
Journal Submissions Trends (2004-2024)
The majority of submissions have been rejected, accounting for 58.67% of all submissions over the 20-year period, whereas 9.3% of the submissions have been accepted.
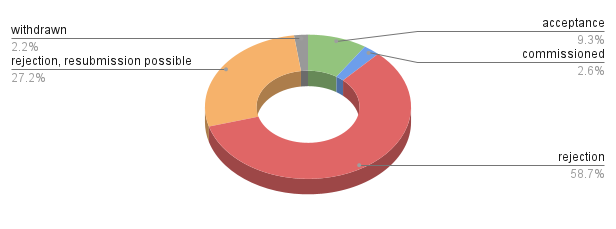
Figure 1: Status of Submissions (2004-2024)
The statistics on jounal submissions from 2004 to 2024 reveals clear trends in rejections and acceptances:
- Rejections Dominate: The rejections percentage has increased in recent years, peaking above 75% in 2023 and 83% in 2024.
- Rejection with Resubmission Possibilities: Approximately 27.24% of submissions were rejected with the option for resubmission. This percentage has fluctuated but has generally declined since 2016.
- Acceptance Rates: The acceptance rate has remained relatively low, averaging 9.31% over the years. However, it has seen some fluctuations, with a high of 17.42% in 2021, before declining sharply to 6.29% in 2024, back to similar rates as in the 2004-2017 period.
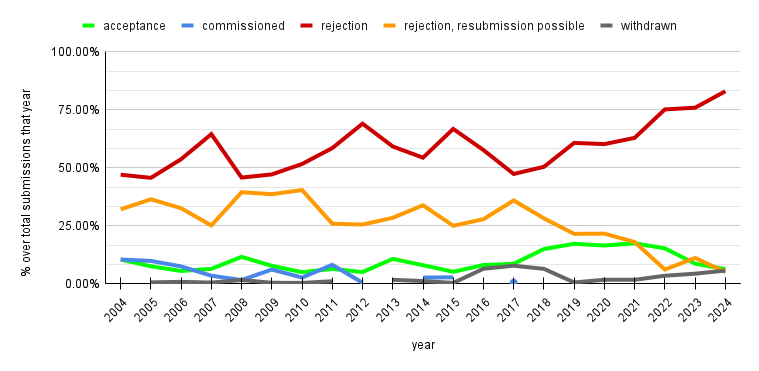
Figure 2: Status of Submissions per Year (2004-2024)
Submissions by Country (2004-2024)
Regarding the origin of submissions:
- The USA (25.9%) and UK (17.3%) are the dominant sources of submissions, making up over 40% of total submissions.
- Other notable contributors include Germany (6.0%), Canada (4.8%), and Italy (3.6%).
- Switzerland occupies position number 9, with 2.3% of the submissions.
- A long tail of smaller contributors, grouped as "Others," accounts for 13.6% of total submissions.
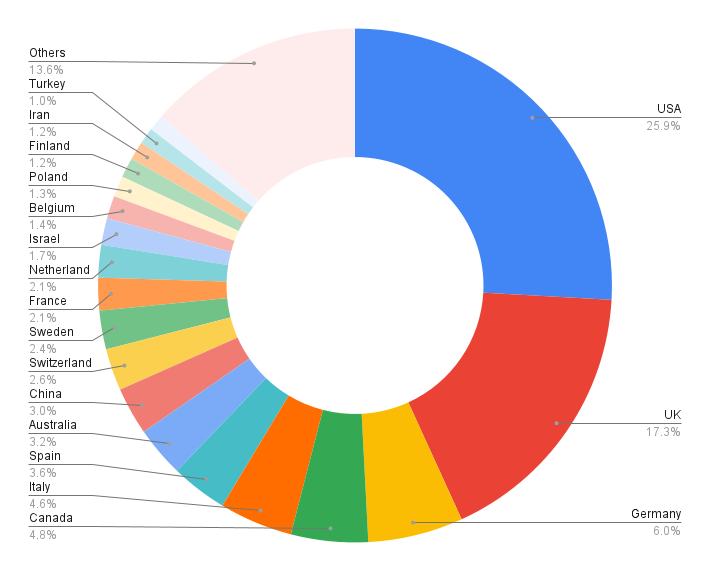
Figure 3: Submissions per Country, in Percentage over Total Submissions (2004-2024)
Submissions are highly concentrated in North America and Europe, with fewer contributions from Asia, the Middle East, and South America. The geographical spread suggests the journal has a stronger reach in English-speaking and Western countries, with relatively lower engagement from other regions.
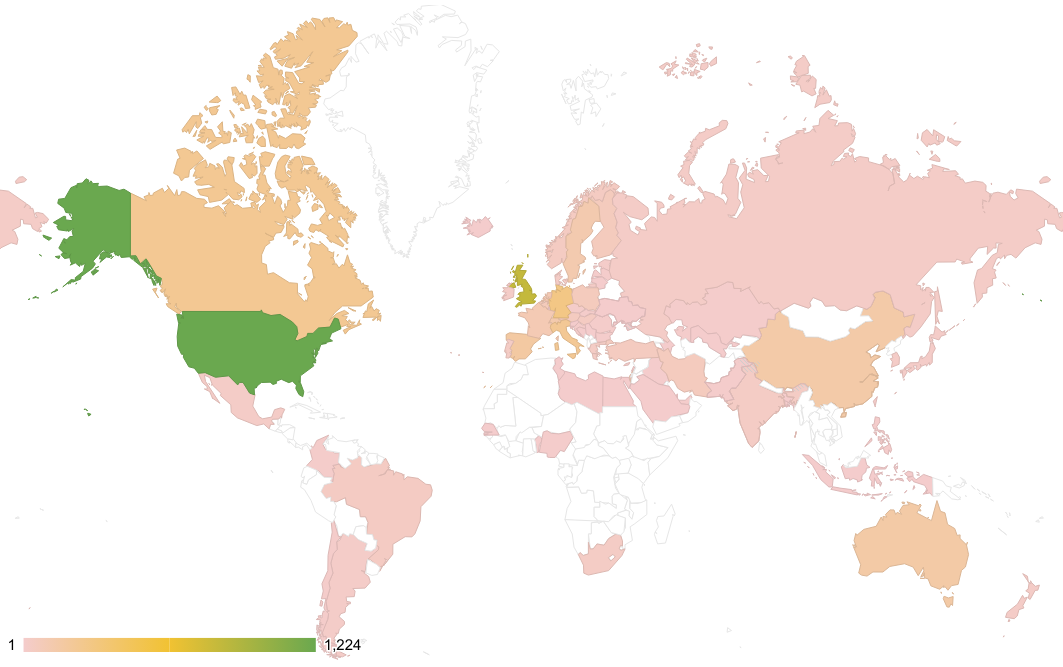
Figure 4: Map of Total Submissions per Country (2004-2024)
Acceptance Rates by Country (2004-2024)
- Austria (27.08%), Switzerland (16.00%), and Germany (14.49%) have the highest acceptance rates despite contributing fewer submissions.
- Sweden (13.91%), the UK (11.25%), and France (11.34%) also show strong acceptance rates.
- The USA (8.25%), despite being the largest contributor, has a lower acceptance rate compared to several European countries.
- Among the countries with the most submissions, Poland (1.61%), China (3.52%), Turkey (4.08%), and Iran (5.45%) have the lowest acceptance rates.
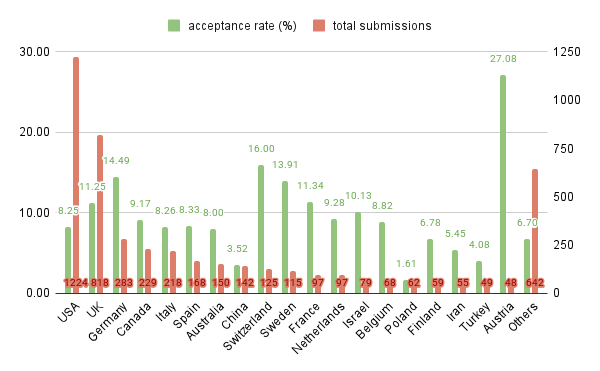
Figure 5: Acceptance Rates vs. Total submissions, per Country (2004-2024)